![]() This is just something that we found recently in Cognitive Match and I thought it might help others who use Couchbase as a NoSQL store, and rely on some of their (otherwise awesome!) graphs, as it seems these can be occasionally misleading — though this is probably an edge case.
This is just something that we found recently in Cognitive Match and I thought it might help others who use Couchbase as a NoSQL store, and rely on some of their (otherwise awesome!) graphs, as it seems these can be occasionally misleading — though this is probably an edge case.
A bit of background: we use Couchbase for some of our data stores in our serving solution in Cognitive Match; the particular data that gets stored in Couchbase gets updated frequently and even more frequently it gets read, however, due to the application architecture, an “eventual consistency” approach to updating this data is fine from our app point of view, and we don’t run complex queries to retrieve the data — just simple “get” operations. And since speed in important when reading the data (and we are ok with favouring reads versus writes/updates), Couchbase works great for us.
Also, in a typical “agile” manner, we release small and often to our production environments, and as such our sysops keep an eye on various overall system parameters and check these after each release iteration to ensure we haven’t introduced any goblins in the system with a new release. Part of these parameters are some of the graphs and stats that Couchbase itself provides in the admin console — with each release we check to see if the number of operations, reads, writes etc has been affected. Typically a decrease in these indicates some problems with the release since our traffic is at least constant if not on the way up.
As such, we have encountered recently this oddity with Couchbase during our latest release — and I thought sharing this would save a lot of stress for other Couchbase users who find themselves in a similar situation. As we were rolling out a release earlier this week, all of a sudden I hear alarm bells ringing and the sysops are jumping up and down flooding my Skype and inbox with messages that suggested nothing short of Armageddon being upon us 🙂
It appears, I am told, that our number of Couchbase operations per seconds has been decreased drastically since we rolled out this new release! Oh my God, we’re doomed, we’re doomed, let’s rollback immediately before the Romulans blast us to smithereens with their plasma guns! 😀
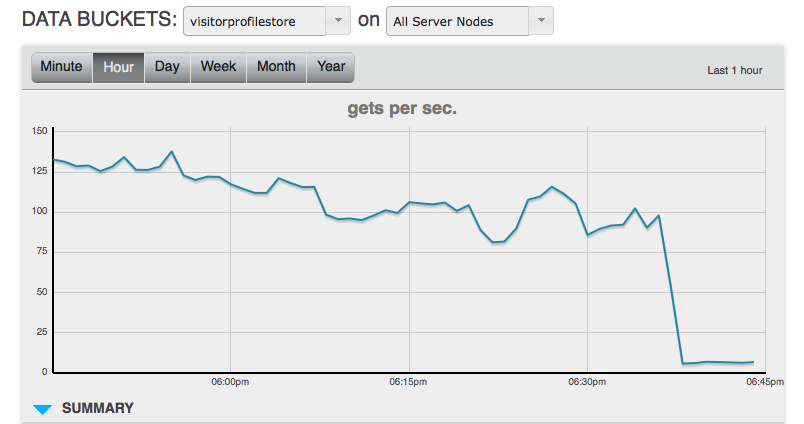
At this point I start doing what anyone in their right mind does: tell everyone to shut up and start digging into this issue. I started looking at one of the Couchbase clusters myself and proceeded to inspect the graphs: indeed, the total operations for seconds shows a huge dip — and it’s not just a down spike, it seems that according to the graphs it them stays relatively constant after the dip. There are still lots of operations per second going through this Couchbase cluster, but it’s now less than half! I have a quick look at our incoming traffic graphs which stayed constant over the last few days, so it’s definitely not the case that we have lost some big client or anything of the kind — as such, Couchbase graphs should stay constant too, hmmmm!
Next step is to break down the graph into “sub graphs”: luckily Couchbase provides separate graphs for reads and writes and looking at this sheds some light into it: it seems the writes have remained constant throughout (and after) the release, however the reads for the cluster seem to have pretty much been ground to a halt — wtf??? At this point the devil on my shoulder starts bouncing up and down screaming “Roll back! Roll back!” and I confess that for a second I contemplated that. Yet as a last check I thought I’d look in some of the server logs to see if there’s anything reported re: Couchbase. To make it even more confusing, the servers are running fine, no errors reporting and I even go and check myself some of the live campaigns and I can see in the logs that actually Couchbase reads are going through with no problems!
Ok, so this rules out the rollback of the release since everything is in fact working fine — the issue we are now left with is that the graphs in Couchbase console are wrong. That doesn’t inspire any confidence moving forward though — also leaves the question of how do we keep track in the future of the reads per second from Couchbase? And ultimately, what triggered this? It’s too coincidental the fact that we rolled out the release at the same time the reads per second graphs went down — and throughout my years I grew to realise there’s no such things as coincidences… I check to ensure we still use the spymemcached libraries for accessing Couchbase — so at least the lower layers of Couchbase access can’t be responsible for this. Next I start looking at the release notes and spotted a small note about using get and touch when dealing with retrieves from the data store — that triggers my attention right away.
So I look at the code and notice that nowadays we use the atomic “get and touch” in a lot of cases when reading from Couchbase — in this particular case this is because some other processing in the backend has changed and as such it makes sense now to keep the records “fresh” in couchbase every time we read from the store — as such we perform the (atomic) “get and touch” on these reads. At first glance this seems as it shouldn’t affect anything right — we still perform a read after all? Though under the covers “touch and read” is an atomic operation which consists of:
- read
- touch (reset the TTL)
- write (set)
So all of a sudden it begs the question: which graph would this occur under??? Reads per seconds? Writes per seconds?
As it turns out it’s not counted as a read — since the drastic decrease in our reads! It’s not counted as a write (set) because it’s not a set — we’re not in fact updating the value! It’s not considered a CAS (Check-And-Set) either — which makes sense, even though in their SDK the result of still the same type as in the case of a CAS operation, it’s not a set! Also, it’s not an update (we are NOT changing the value)! So it’s an operation in its own right — but, unfortunately, the Couchbase console does not account for that operation type in a graph of its own, so unfortunately there’s no way of monitoring those using the out of the box graphs in the Couchbase console, which, the moment one start using the “get and touch” starts showing skewed numbers — confusing or what?
So if you decide to use “get and touch” in your Couchbase implementation, beware of the devil in the details: your graphs will start showing no reads for each such operation — and no writes either. However, if you take this to the extreme and you only use get and touch you will see that there’s still disk I/O — and if you don’t know of this little glitch you will be pulling your hair from here to eternity as personally I couldn’t find anything on the net around this! 🙂


Hello,
So it looks like it is a bug (missing feature) inside Couchbase, I have logged a JIRA for this:
http://www.couchbase.com/issues/browse/MB-8183
Thanks for capturing this and explaining the source of the issue.
Regards
Tug
@tgrall
Liv, thanks for writing this up, it’s a good find. We’ve got an open bug for “get and touch” along with a few other operations to get included in the appropriate operations.
Perry
Thank you both for spotting this post and linking it to the open issue in your JIRA — much appreciated! Will keep an eye on that issue and hopefully post an update soon here when it gets solved!