A while back I’ve boasted on this very blog about the amount of traffic it has reached — based on stats that I have pulled up from the Wassup WordPress Plugin. I have decided recently to have a closer look at the traffic — any blogger who’s taking himself seriously checks now and then on his audience! — and part of this I have decided to look in the server access logs myself and see how much they tally up with Wassup, as well as looking for a trustworthy 3rd party to quantify some figures for me too on this so I can have 3 reference points in this comparison.
For the purpose of this exercise, I have decided to use QuantCast as my 3rd party provider of analytics — they are a well established name and provide interesting analytics not just on page views, visits etc but on unique users, audience breakdown and so on.
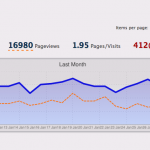
I guess I did suspect after all some issues with Wassup — it’s always difficult to figure out, from running on the server side, what a page consists of! — so I implemented the QuantCast tag on my pages some 3-4 weeks ago and finally had a look at the results. To be honest, I’m not doing bad at all! Their measurements (over just over 3 weeks) came with 600+ unique visitors — this from what I can tell excludes robots, spiders, spammers and so on, so quite pleased with that. Waiting in fact to see what their aggregated figures over 90 days period look like.
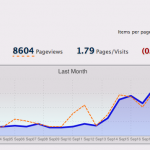
However, one thing QuantCast underlined is that the pageviews and page hits in Wassup are not to be trusted that much. Granted, their tag has to be at the bottom of my page, and I have noticed occasionally (due to other components in the same area) that the bottom part takes a while to load — note to self: sort this sh***t out 🙂 — however, I don’t think i can attribute more than 10% discrepancies due to occasional network issues.
With that in mind, I have set off to investigate the traffic myself by looking at (a portion of) the server’s access logs. This is where it gets interesting: the access log of course contains a list of all the requests made against my webserver — this includes requests for images, for java script files, plugins and all sorts. As such, it can be tricky sometimes to indentify what a page view is — so I had a quick go at grepping this access log and try to identify the HTTP calls to the “top level” pages.
Here’s the script that I came up with — I’m sure it’s not complete but it seems to work!
grep -v "POST /wp-comments-post.php HTTP/1.1" $ACCESSLOGFILE | grep -v "GET /tag/" | grep -v "GET /robots.txt" | grep -v "GET /wp-cron.php" | grep -v "GET /feed/" | grep -v "GET /wp-includes" | grep -v "GET /wp-content/" | grep -v "GET /wp-admin" | grep -v "POST" | grep -v "GET /wp-login.php" | wc -l |
On running this on an hourly access log, I now get about 30 page requests (per hour) — this suggests (on an average of 10 browsing hours per day) about 300 page views a day which means about 3-4k page views a month. Currently QuantCast seems to suggest less than that — however, their tag needs to be running for about 90 days as per their recommendations to get a correct view on stats, and also, my “script” above doesn’t filter on any user agents (so spiders and so on DO get included unfortunately).
Nevertheless, the good news is I still have significant traffic, and the bitter news is that I need to talk to the Wassup guys and see what’s wrong with their analytics.
On a more interesting (from a technology point of view) note though, I would be keen to talk to someone who’s been looking at these sort of simple greps to identify a more accurate number of page views, strictly based on apache access logs, in the context of a WordPress installation. Anyone?