 This is a rather interesting find and I’m still looking into it — so hopefully will come back with more insights on it — but I thought I’d publish these things as I find them. So bear with me as I unravel this mistery — as of right now, unless I’m looking in the wrong place (ok, ok, I haven’t looked at the source code yet, but seriously, if you find something not quite right with Apache Tomcat are you going to go and look straight at the sources? :D), there’s definitely not enough on this matter on the net.
OK, so this came to my attention looking at some production code we have which occasionally causes some oddities on our servers. This is some Scala code running on top of the Play! Framework. More to the point, it actually causes some memory leaks. First things first with such situations: let’s look at the source code. First glance all seems good and proper — some regular Scala code. A second look though revealed an interesting thing: one of the singletons used (long story why a singleton but it does make sense to use that pattern) uses a ThreadLocal. Why that might not seem like to much, from my previous experience with a lot of Java code, ThreadLocal‘s should be your first alarm bell for memory leaks. So I start to look more into it.
Turns out, following the logic in the code, that the bit of code that gets called from inside one of the controller. Now that’s fine, you’d say, the controllers in the Play! framework get their own threadpool and as such there will be N ThreadLocal‘s being created, with N being the size of the thread pool right? If only… As it turns out, running a fork-join thread pool in Play! Framework creates a few problems. More to the point it creates threads and then destroys them as and when needed. Trouble is, if you have a ThreadLocal, that stays bound to the thread context… and as such, while the thread itself is no longer running, the Thread object never gets finalized and as such it ends up slowly eating up your memory!
To verify this I wrote a very simple test — this is written in Java (which rules out any Scala compiler problems — for the skeptics out there). I will probably follow up with a version in Scala too but it’s a safe bet to say I’m sure that the usage of Java vs Scala is NOT the problem. The idea behind it is simple: just have a ThreadLocal initialized somewhere in a class and reference that straight from one of the Play! Framework controllers. Have a fork-join threadpool configured for the application then simply hit the controller hard with lots of requests and see what happens.
NOTE: the whole code and JMeter test plans for this are to be found on GitHub following this URL: https://github.com/liviutudor/playframework-threadpool-test .
The ThreadLocal can be found in models/TLocalTest.java and the relevant part is this:
private ThreadLocal<String> memoryLeak = new ThreadLocal<String>() { protected String initialValue() { int current = COUNT.incrementAndGet(); System.out.println( "Got to " + current ); return "This causes a memory leak : " + current; } }; |
As you can see nothing fancy: simply build up a String which based on a message and a counter. The counter, if you look in the code is a static final AtomicInteger and gets incremented each time we create a new ThreadLocal — this way we can distinguish in between them as well as keep track of how many we created. I’m also dumping this String to console, as it makes it so much easier to inspect these values rather than start looking at JMX and the likes.
Now to test this, I’ve used JMeter — I like it for simple web testing and I highly recommend it. You will find a few JMeter test files in the public/jmeter directory, I’ll refer to them individually throughout this post. I will also point out throughout this when I change the threadpooling configuration for my Play! app, but to start with I’ve used something pretty basic (see conf/application.conf):
default-dispatcher = {
 fork-join-executor {
  parallelism-min = 12
  parallelism-max = 12
 }
}
Worth reminding ourselves here of all the configuration options and their meanings here: http://doc.akka.io/docs/akka/2.1.0/general/configuration.html#Listing_of_the_Reference_Configuration — I will refer occasionally to this.
Having set up all this, the first test (tlocal1.jmx) is a simple threadpool of 1,000 threads (“users”) firing requests 1,000 times at my play app. (Remember to start your app using play start and not play run — so prod is enabled for configuration rather than dev.) As one would expect, firing this test at the play app, configured with parallelism level 12 creates 12 threads — and 12 ThreadLocal instances! — and these guys take all the load. The output will be something like this in the console:
Play server process ID is 7862
[info] play - Application started (Prod)
[info] play - Listening for HTTP on /0:0:0:0:0:0:0:0%0:9000
Got to 1
Got to 2
Got to 3
Got to 4
Got to 5
Got to 6
Got to 8
Got to 7
Got to 9
Got to 10
Got to 11
Got to 12
So we know we got 12 ThreadLocal‘s created based on this. If you let the test run in JMeter you will notice this does not change — in other words exactly 12 threads are created (and assumed to be used) till the test finishes.
Now if you’re of a curious nature like me after the test finishes try this again — re-run the test, without exiting the Play! app. As it happens, I have thought of doing this about 1 minute after I’ve run the test, as I’ve gathered first screenshots and what-not for this post — and as it turns out, this is sort of important (the delay). So give it a short period of time then re-run the JMeter test without exiting anything — this is what I get in my console (continued from the last line above):
Got to 11
Got to 12

Got to 13
Got to 14
Got to 15
Got to 16
Got to 17
Got to 18
Got to 19
Got to 20
Got to 21
Got to 22
Got to 23
(I’ve added the empty line after “Got to 12” just to make a demarcation in between the 2 JMeter test runs.)
Whooaaa!!! WTF happened here??? Reading this correctly, it means that 12 new threads were created — and as such 12 new ThreadLocal instances!
Might not seem like a big deal, but anyone who’s worth their money when it comes to memory leaks in Java will tell you this is screaming memory leak! In this particular context, maybe not, because the ThreadLocal returned by our singleton is simply used to write a message on the console and assemble a simple HTML page — but what if that instance is stored somewhere in a cache/context holder/object pool etc? At that point, that object will NOT be eligible for garbage collection right (it’s still got a handle on it!) — and as such the ThreadLocal will not be eligible for garbage collection… and as such your Thread instance which was used for doing all the work will not be eligible for garbage collection — even though it’s been ejected out of the Play! thread pool! So you end up with all these Thread and ThreadLocal instances hanging there somewhere in Valhalla not used by anything or anyone but having a damn good life in your heap! (Until of course the OutOfMemoryError ruins it for everyone and your app crashes…)
OK, now you can argue that perhaps this was just some sort of edge case some coincidence etc. True, true, that could be it, so let’s leave the threadpool configuration to the same one, and let’s change the test plan to spawn this 1,000 requests then take a break then do it again. Let’s also stop and re-start our Play! app so it starts with fresh heap, object instances and all those goodies — in other words, so that we cannot let the previous test mess up the second test (test plan in tlocal2.jmx). Now this is what running this on my Mac renders:
[playframework-threadpool-test] $ start

(Starting server. Type Ctrl+D to exit logs, the server will remain in background)

Play server process ID is 8033
[info] play - Application started (Prod)
[info] play - Listening for HTTP on /0:0:0:0:0:0:0:0%0:9000
Got to 1
Got to 2
Got to 3
Got to 4
Got to 5
Got to 6
Got to 7
Got to 8
Got to 9
Got to 10
Got to 11
Got to 12
Got to 13
Got to 14
Got to 15
Got to 16
Got to 17
Got to 18
Got to 19
Got to 20
Got to 21
Got to 22
Got to 23
Ooopsss!!! Same issue seems to occur here: initially 12 threads are being created and take on the work then at some point they get killed, during the break, and some more are being created when the traffic comes back on. Interestingly, second time around, again, only 11 more are being created rather than 12, so there’s one kept lingering there somewhere which makes sense: it means one thread is always kept alive (you don’t want to have no threads available when the first request comes in and spend time creating a Thread instance right?). You can run this test as many times you want on as many fresh Play! instances and you will get the same result — so I’m going to argue this is not coincidence here anymore!
Now as you might have noticed in our configuration, we are using a fork-join-executor — how about we try a thread-pool-executor, with similar parameters (12 threads) and see if that makes a difference? So I’ve changed the configuration to look like this:
actor {
 default-dispatcher = {
  executor = "thread-pool-executor"
  thread-pool-executor {
   core-pool-size-min = 12
   core-pool-size-max = 12
  }
 }
}
Then since we’ve established the pattern with new threads being created, I’ve run only the second test (tlocal2.jmx). The output, woohoo, indicates that at the end of the test run only 12 threads (and ThreadLocal instances) have been created! This is encouraging now. So let’s take it one step further!
Test 3 (tlocal3.jmx) is based on Test 2, but it does the same thing 5 times with a delay in between and also aggregates the results so we have an idea of the average / median values and so on. Running this using the same thread-pool-executor, not surprisingly, shows that we always have only the 12 threads (and ThreadLocal‘s) created at startup and also running it on my Mac, we get an Avg ~ 12 ms, the median being at 3 ms and 90% line at 16 ms (the rest of the data is irrelevant for the purpose of this to me, as I’m only planning to use this values for comparisons):

Now, having established this for the thread-pool-executor, let’s have a look again at the fork-join-executor and see if there is any impact on the performance. So I’m changing the executor to a fork-join-executor again and running test 3 against the Play! app again — which renders this:
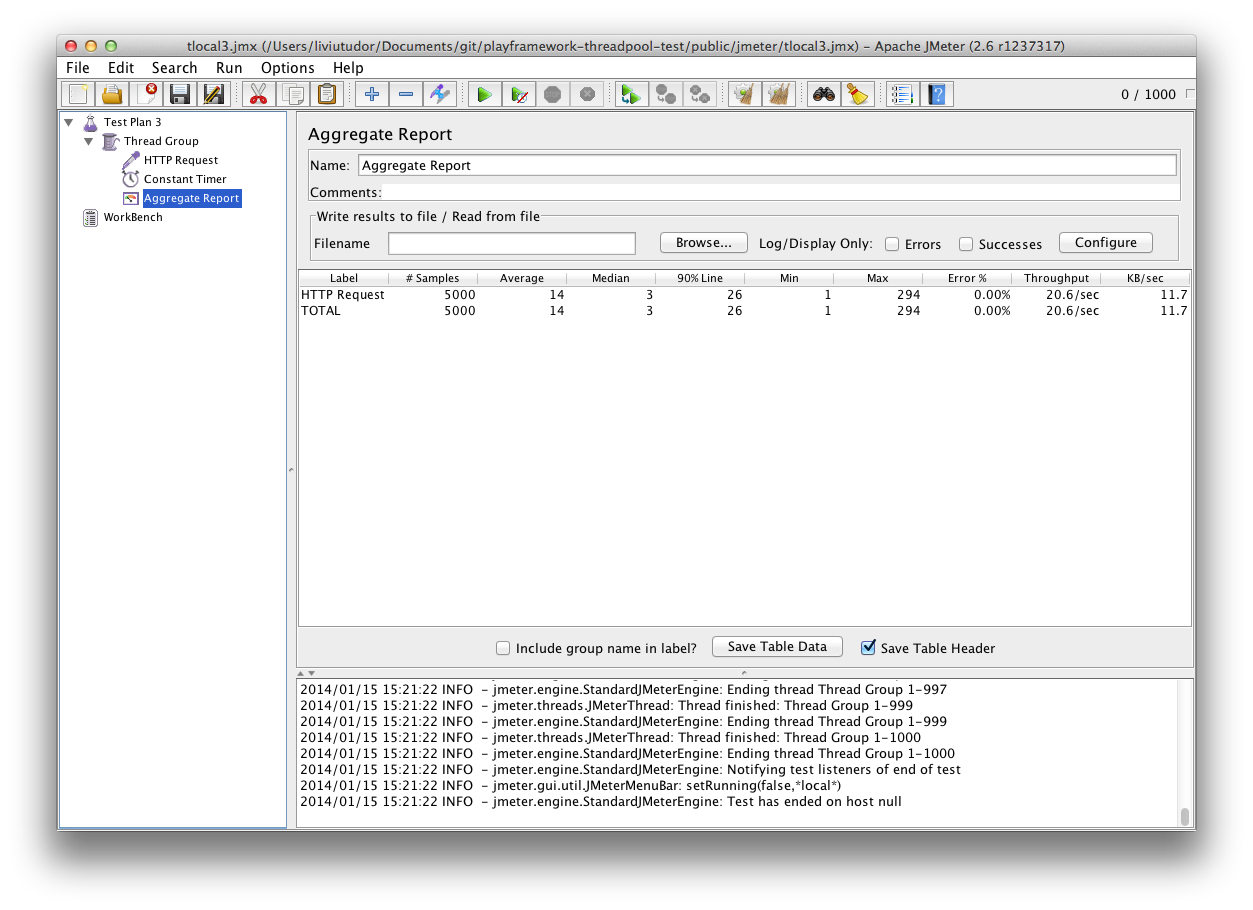
So it turns out, even though I’ve created about 57 ThreadLocal‘s running this test against the fork-join-executor, the performance numbers are similar comparing to your standard thread-pool-executor: an average of 14 ms, median at 3 and 90% at 26 ms.
Bearing in mind that these are not proper stress tests, instead as I said, I’ve only used these values to compare orders of magnitude in between the 2 implementations, I would argue that the performance of these 2 implementations is actually similar. At least at this load…
However, the Play! Framework is promoting by default the fork-join-executor, so I can only but guess this is performing somehow better than the default thread-pool-executor. OK, so let’s look at the configuration options for fork-join-executor again then. According to their configuration page, there’s nothing more to it then the parallelism-factor — which, as much as I have played with it doesn’t seem to make a difference.
The thread-pool-executor has an interesting setting though : keep-alive-time; as it turns out, the default value is 60 seconds which means that my tests have been slightly missleading as should I set them to wait 61 seconds in between tests I would hit the same problem about creating ThreadLocal instances as with the fork-join-executor. However, having that configuration there allows me to do something (silly, granted, but fixes my problem): I can set this keep-alive-time to 24 hours — which means, in the case of my production application that I will only encounter this if the server goes through one day without any traffic at all. (Anyone working in Internet advertising will tell you that if you get one day with no traffic then something is terribly wrong — upon the lines of your company shutting down quite likely, at which point you won’t care that much about memory leaks! :D) So I can force the thread-pool-executor not to kill the threads using a setting like that.
Armed with that configuration option I’ve attempted to use it inside the fork-join-executor — and sadly it doesn’t make any difference… There must be a configuration option inside that fork-join-executor which dictates when threads are dumped from the pool to keep the pool lean and clean but I can’t find an indication as to what that value is. Even worse, it’s a different one to the 60 seconds one employed by thread-pool-executor — lower as it turns out — as such the problem with memory leaks like this appears much quicker in the context of a fork-join-executor.
Moral of the story? Well, I guess the fork-join-executor is kick-ass all brand new and shiny, but it creates memory leaks with my ThreadLocal‘s — so until I figure out what other configuration options are there to allow me to control the expunge-cleanup-create mechanisms inside the executor, I’ll have to stick to a thread-pool-executor with a configuration upon these lines:
executor = "thread-pool-executor"
thread-pool-executor {
 core-pool-size-min = 12
 core-pool-size-max = 12
 keep-alive-time = 86400s
 # 86400s = 1 day
}
I’ll follow up soon hopefully on this with more findings about the fork-join-executor, but that might require me digging in the Play! Framework codebase so might be a while unfortunately…
As noted at the beginning of this post, the whole code and JMeter test plans for this are to be found on GitHub following this URL: https://github.com/liviutudor/playframework-threadpool-test .


I am confused how threadlocal is causing memory leak? First threadlocal, by definition, should only be relied as long as thread is alive. Once thread is dead, that thredalocal reference count is reduced. If your application stores result of threadlocal inside a global cache….. very odd usecase, where you went from scope of threadlocal to global cache, still, its not a memory leak due to forkjoin
You are right about the fact that yes a ThreadLocal lives in the current thread only, however! Bear in mind that a lot of frameworks nowadays use thread pools, where the thread objects are still alive but they don’t do any work. These objects will then hold unneeded references to threadlocal’s which never go out of scope — which is how the memory leaks creep in.
I am having similar problem but with ExecutorService.